Tatari Measurement & Reporting Dashboard
Designing a scalable, self-serve analytics platform for Linear and Streaming TV.
Data Visualization • UX/UI Design • Product Strategy
Context
Tatari is a TV analytics and media buying platform that helps brands measure and optimize performance across Linear and Streaming TV. As Design Director, I led design for the Measurement and Reporting team, building tools that transformed complex campaign data into clear, actionable insights.
Problem
When I joined Tatari in 2016, we were a seven-person startup building fast and scrappy. Our chief strategist was spending most of his time manually generating client reports in Excel, pulling data from the data science team, creating slides, and walking clients through performance one presentation at a time.
The process was inefficient and error prone. It did not scale. Clients wanted answers instantly, while internal teams were stuck servicing ad hoc reporting requests instead of focusing on innovation.
Reporting time
8 hours per client
7-person team
Increasing reporting load
Opportunity
We needed to transform a manual, human-powered reporting process into a dynamic, self-serve experience. One that allowed clients to explore performance data on their own and freed internal teams to focus on strategy and future product development.
Approach
I worked closely with the CEO, Chief Data Scientist, and Chief Strategist to define the product vision from the ground up. Through whiteboarding, sketching, wireframing, and prototyping, we translated complex Excel-based workflows into intuitive visual systems.
I researched and tested different approaches to data visualization to determine how each dataset could be communicated most clearly. I also sat in on client presentations to understand where users struggled to interpret results and to anticipate how their needs would evolve as new capabilities were introduced.
Solution
The result was a modular, interactive reporting system that surfaced key insights at a glance and enabled deeper exploration through intuitive interaction patterns. The system was designed to scale gracefully as Tatari’s data capabilities and offerings grew.
Static reports
live dashboards
Fragmented data
unified views
Guesswork
actionable insights
Flexible time exploration
Composable filtering across dimensions
Custom segmentation for strategy analysis
Progressive disclosure for complex data
Fast, low-friction decision controls
Clients could instantly see which creatives performed best, how performance varied across networks and time slots, and which audience segments delivered the strongest results.
The dashboard turned reporting into a self-serve system, allowing customers to learn meaningful things about their campaigns without relying on custom reports.
Impact
We replaced a manual, hours-long reporting process with a self-serve system that delivered insights in minutes.
This reduced reliance on internal teams, scaled with the business, and allowed strategists to focus on optimizing performance rather than producing reports.
Reflection
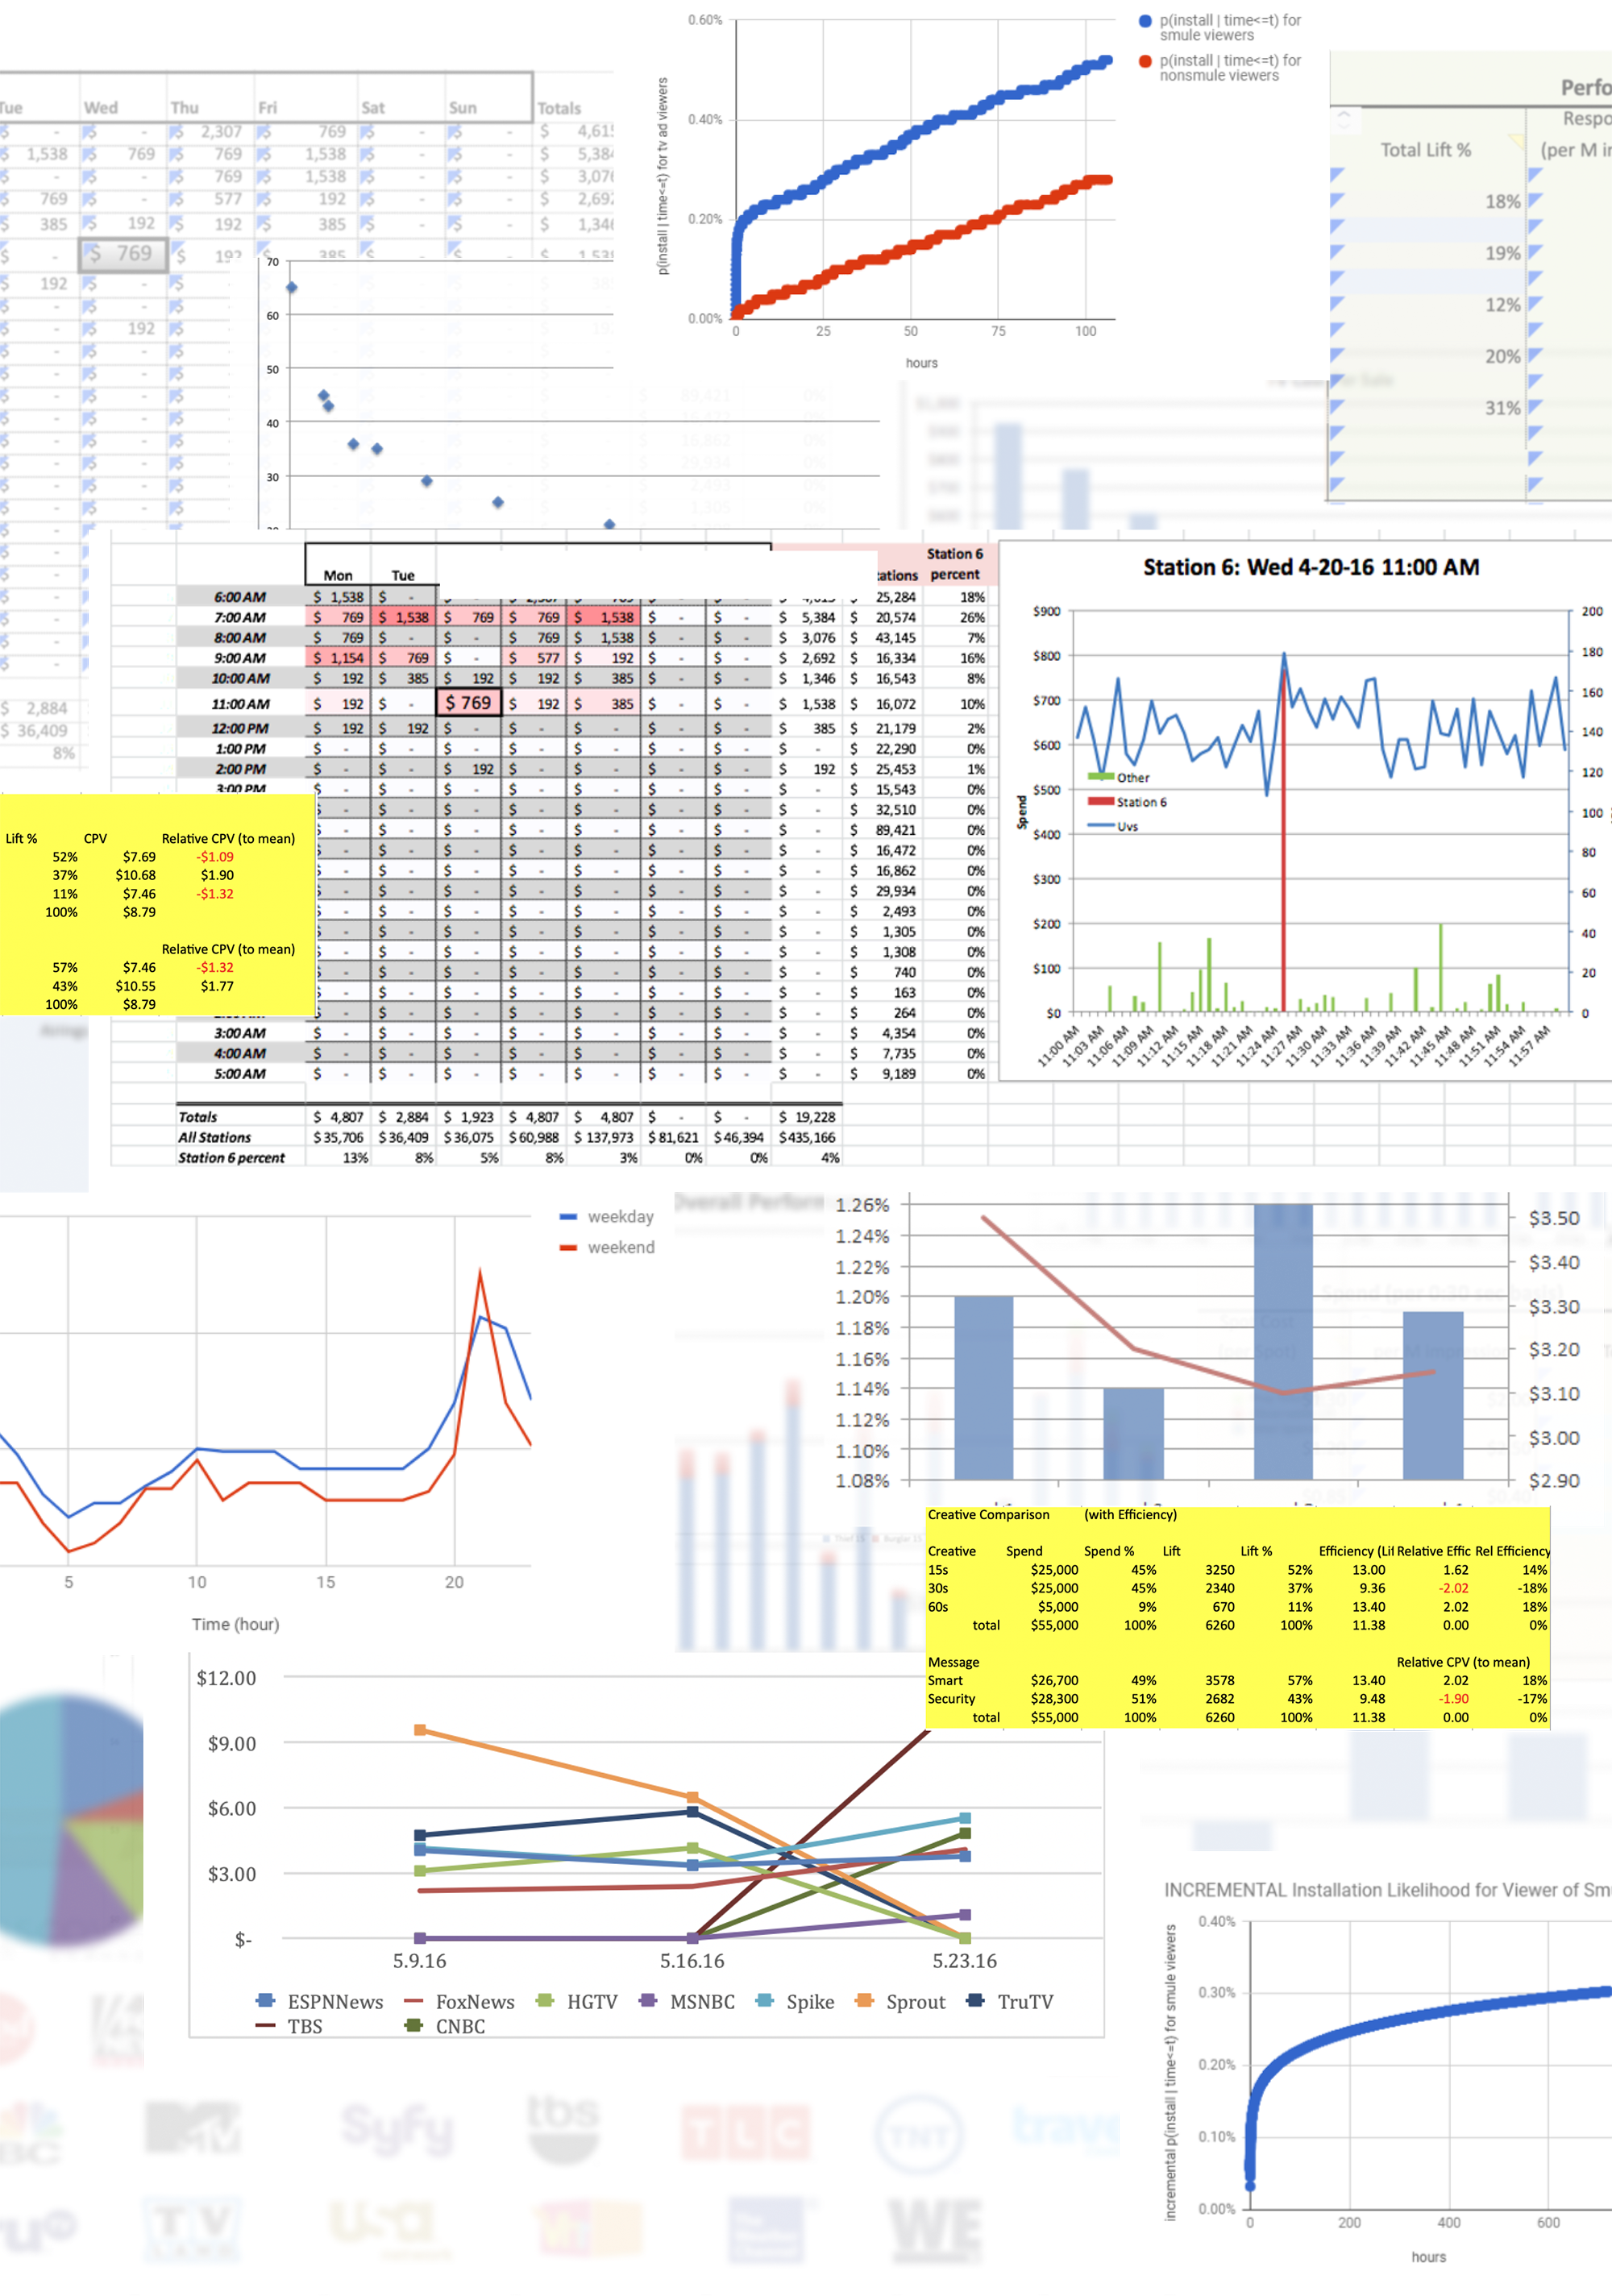
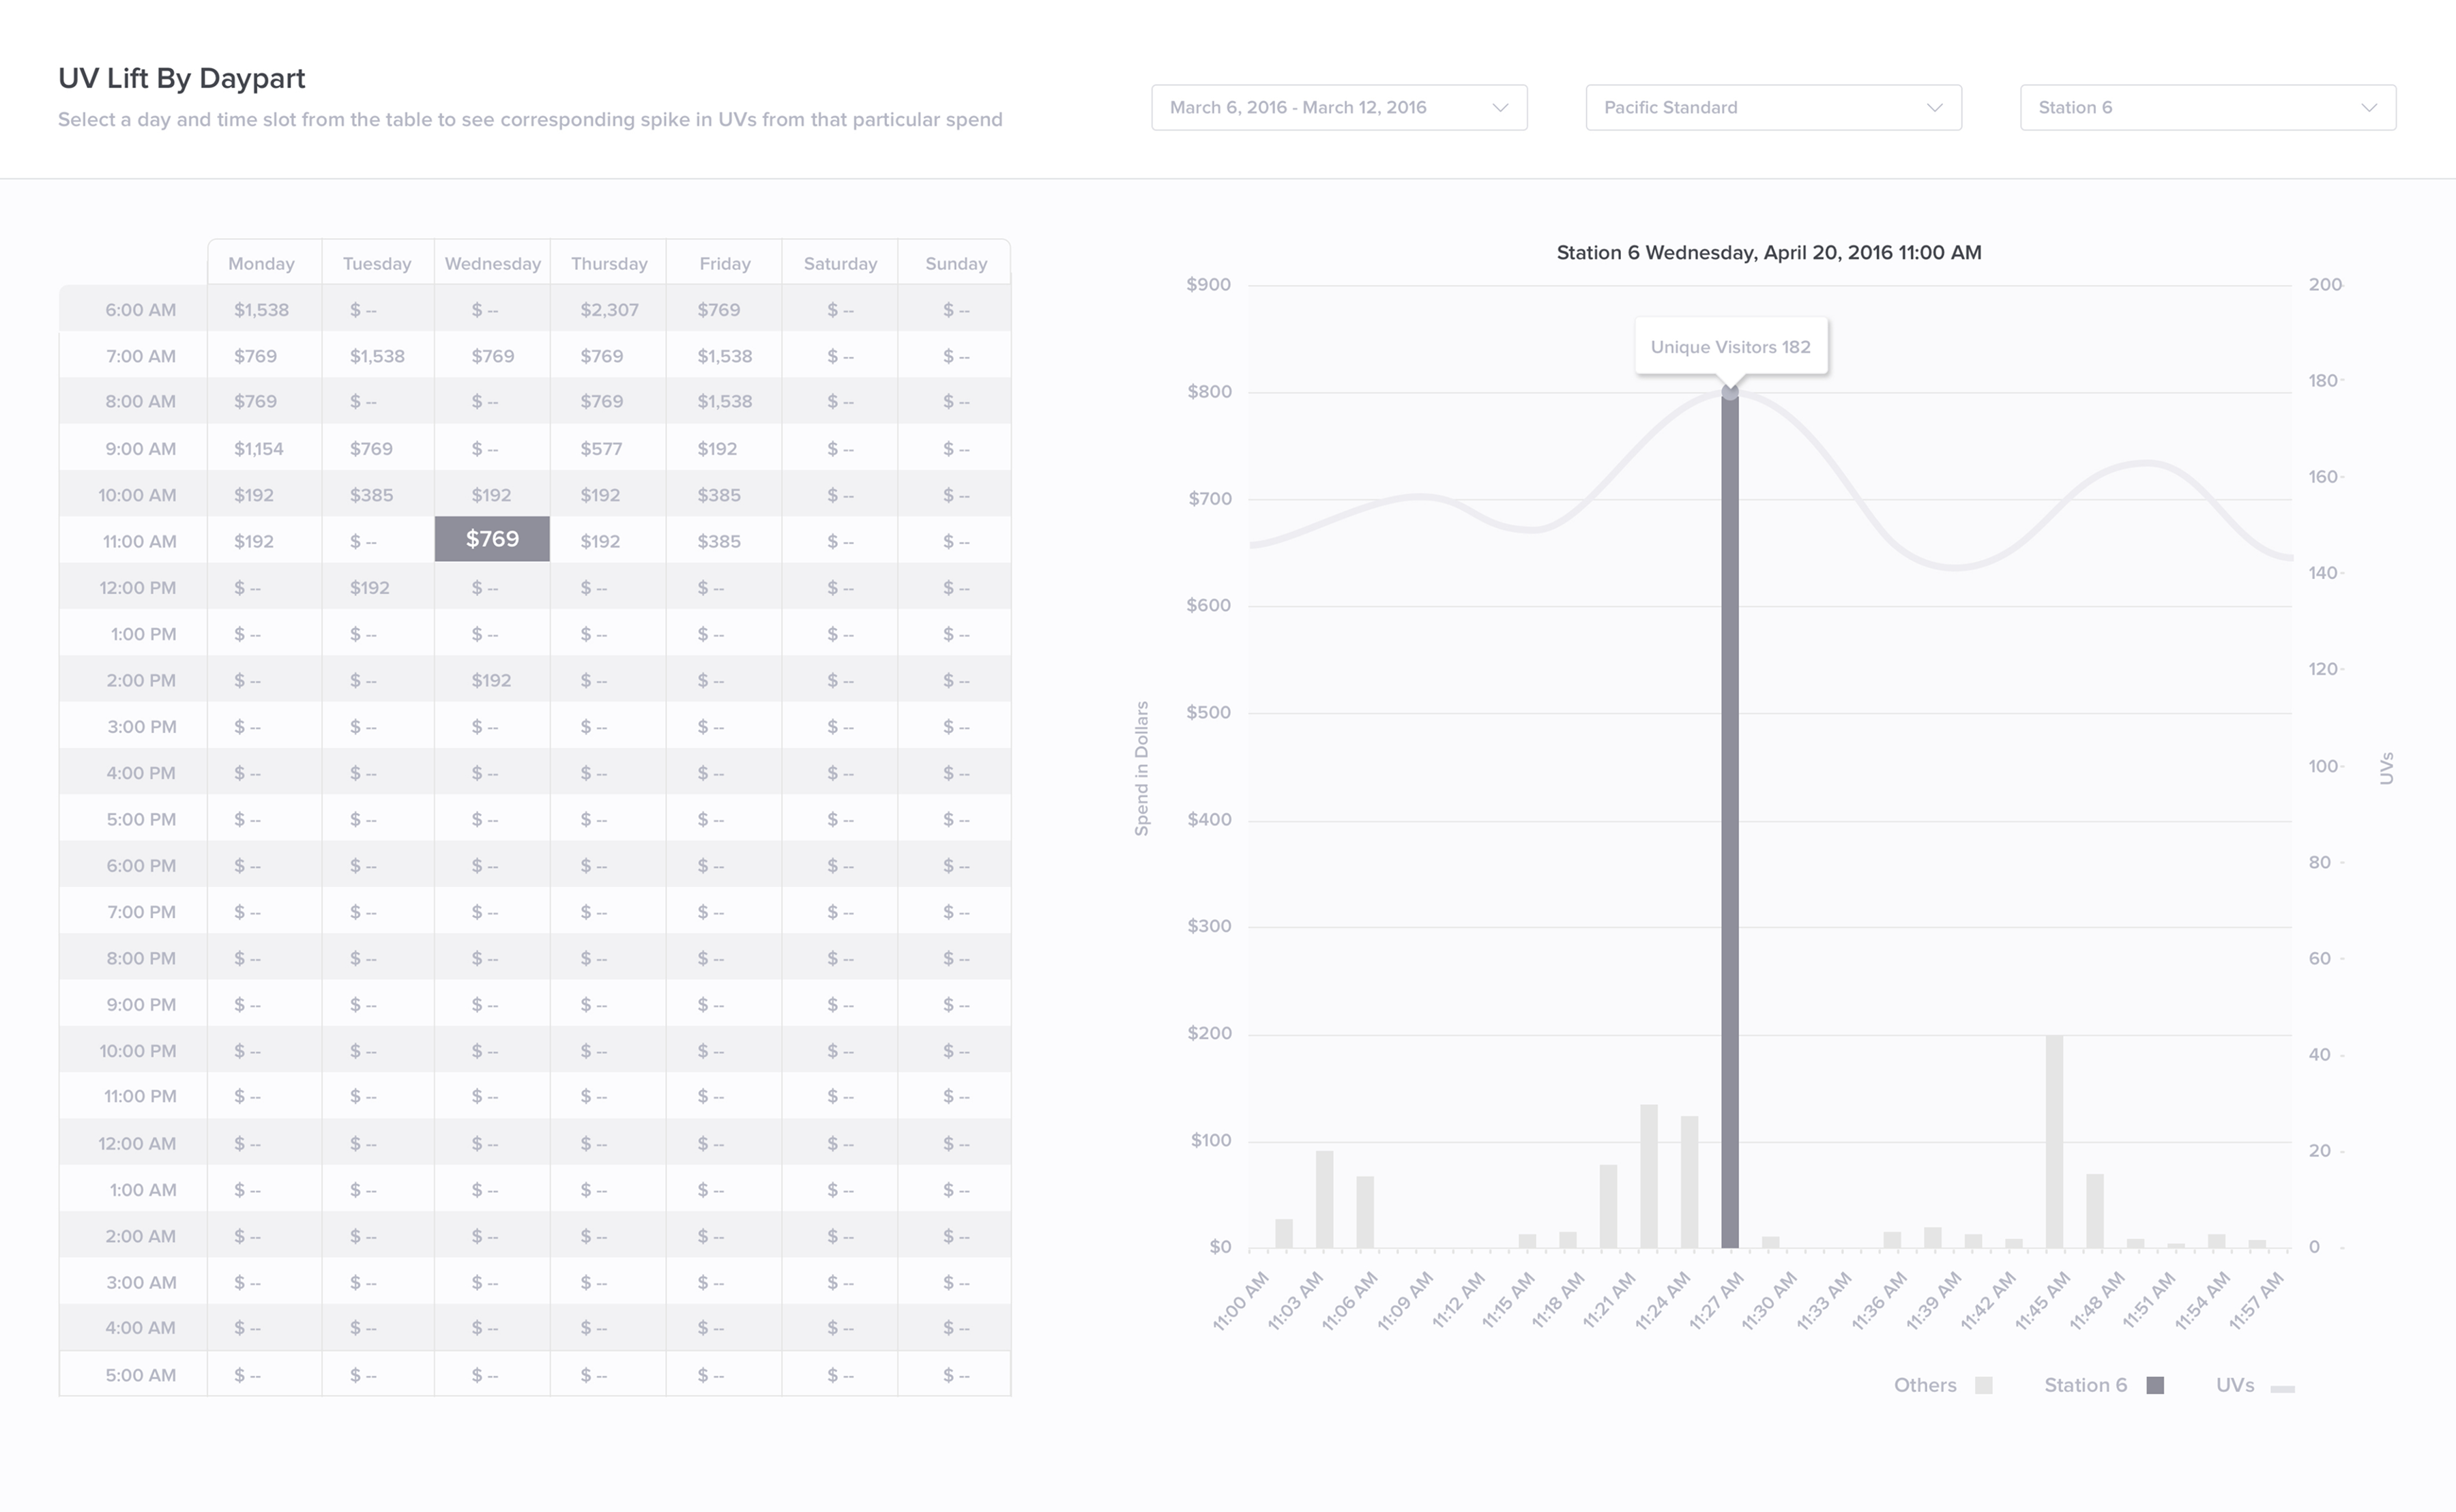
Early on, we built visualizations one by one in order to move quickly. As the product matured, introducing a design system brought consistency, speed, and scalability. It made it easier to onboard new designers, maintain a high level of craft, and evolve the platform without sacrificing clarity or usability.